
Last time I promised I would write about the legendary German Döner Kebab–a.k.a. Dönertasche (e. döner-pocket). I promised weekly posts. That was way to optimistic. So, I am changing that promise to every other week, or so.
Last post was perhaps mildly interesting, and instead of following a path of increasing returns I am going to dive straight into decreasing returns on joy of reading. So, I’ll talk about the data. Literally. The data and it’s issues and trade-offs. And I’ll stay on brand and do it in an incredibly messy and disorganized manner.
Have fun.
In my last post Ishared a map with you showing the different price level in different German states. Recall:
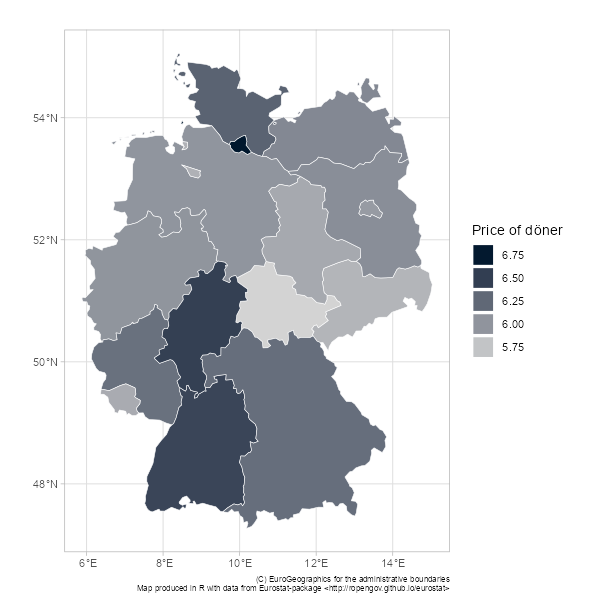
This map, a bit boring, but also a bit interesting, kinda suggests that the fashionable east-west split is perhaps dying and being reborn as a north-south sandwich, at least from a döner perspective.
However, as I disclosed last time, at the time of presenting this graph no proper data cleaning had been done. I had basically only dropped any invalid postcodes and any observation where I determined (with the science of assumption!) that the respondent had either put in the wrong state or postcode.*
Goddam duplicates
One annoying thing about the Reddit questioner is that it is impossible to tell what restaurants have been inputted more than once. The input form only asks respondents for three things: postcode, state and price of a döner-with-everything.
So, therefore I have fucking duplicates, but I cannot tell which once they are.
I wrapped my head around this issue again and again. I obsessed, “how to adjust the data for double counting.” I trawled through the data. I looked at all the postcodes with loads of kebab places in the data. I turned every stone. And I almost lost the will to live.
First of all, if I just drop any duplicated rows of data (any response in the same postcode with the same price) I risk dropping actual informative data and under/overestimate the average price in that postcode.
Take for example these two postcodes. Let’s start with 76131, Oststadt in the city of Karlsruhe, bordering the postcode of Germany’s high court, the infamous BGH. For 76131 the Reddit survey had 30 responses. 19 of them were registered as charging 7€ for a döner. If I take this at face level, the average price in Oststadt, Karlsruhe is 7€.
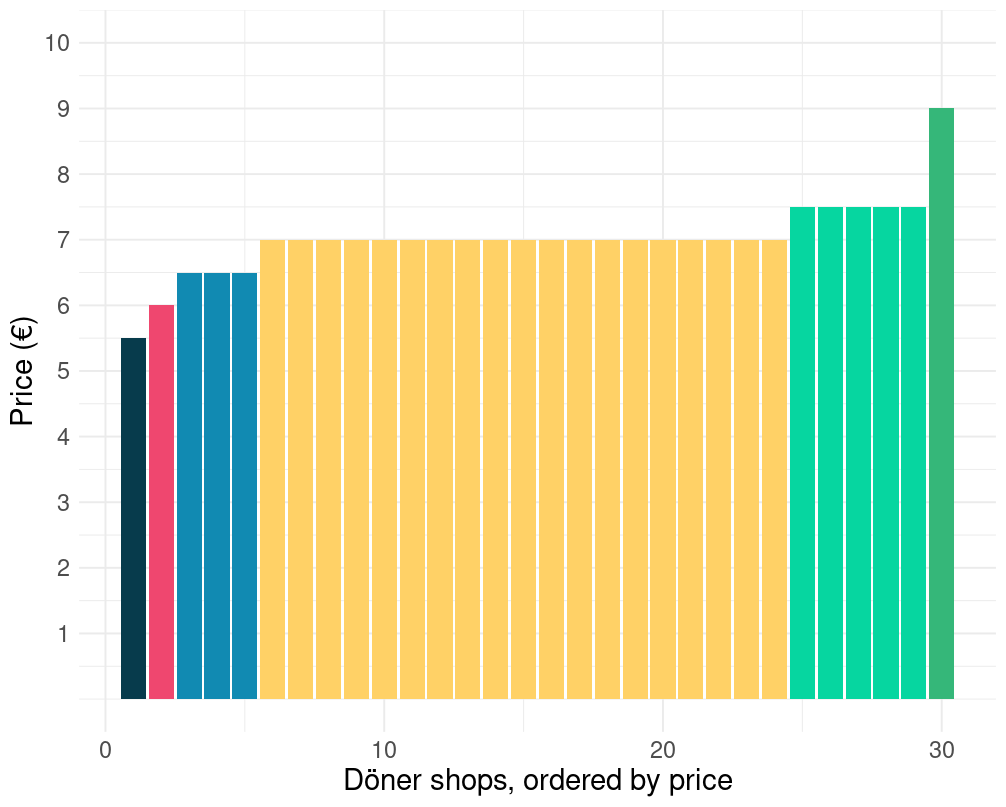
Now, say I was to assume that all restaurants in the data with the same postcode and the same price are the same restaurant, I’d get a picture like this, implying a much lower average kebab price of 6.6€.
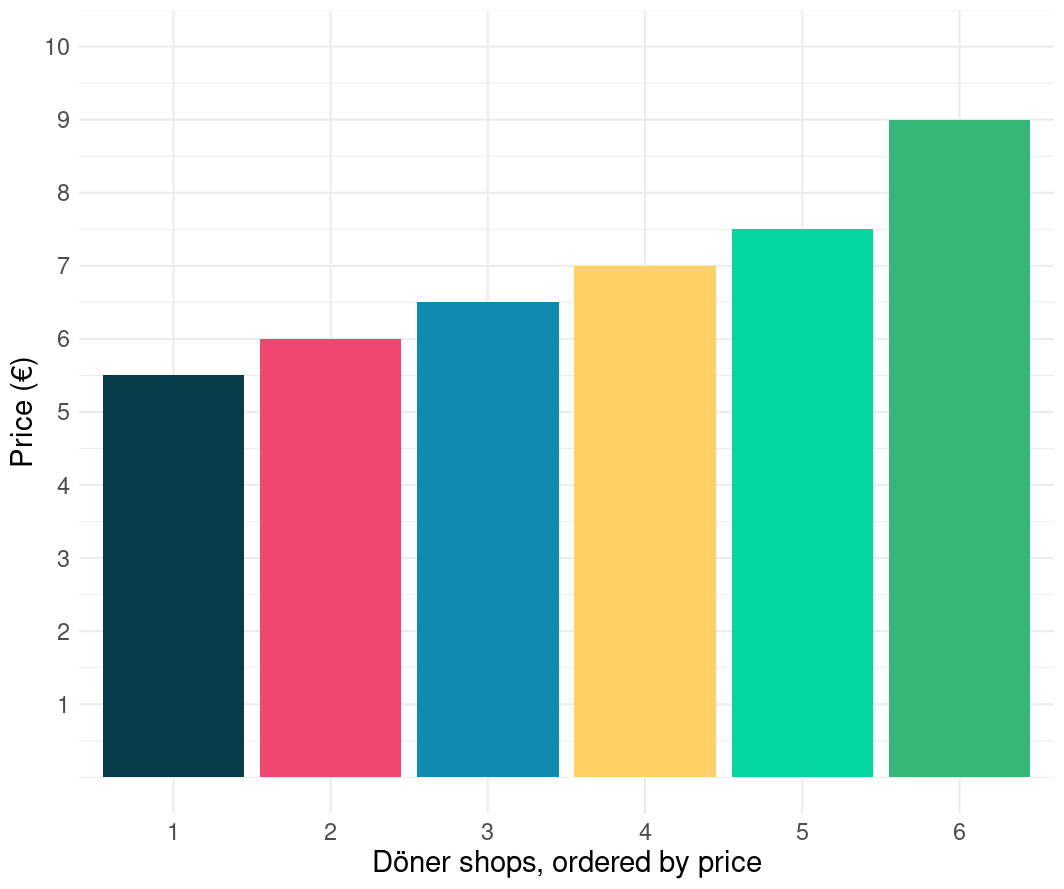
I also downloaded döner places from google (more on that data later). Just as a cross-check, obviously, as one does. What I found was that the second graph is probably closer to reality on the ground in Oststadt, Karlsruhe. The Google search returned around 8 Kebab places in that postcode. But, even if that would produce a better straight average, or an average price of the döner on offer, it might still be the wrong method.
First of all, the price at the most popular kebab place should have a bigger impact on the average price than that of the least popular kebab place. In other words, to calculate the average price we need volume of sales to weight the price . And, it might well be, that the the most popular places are indeed the places that are the most often entered by Redditers.
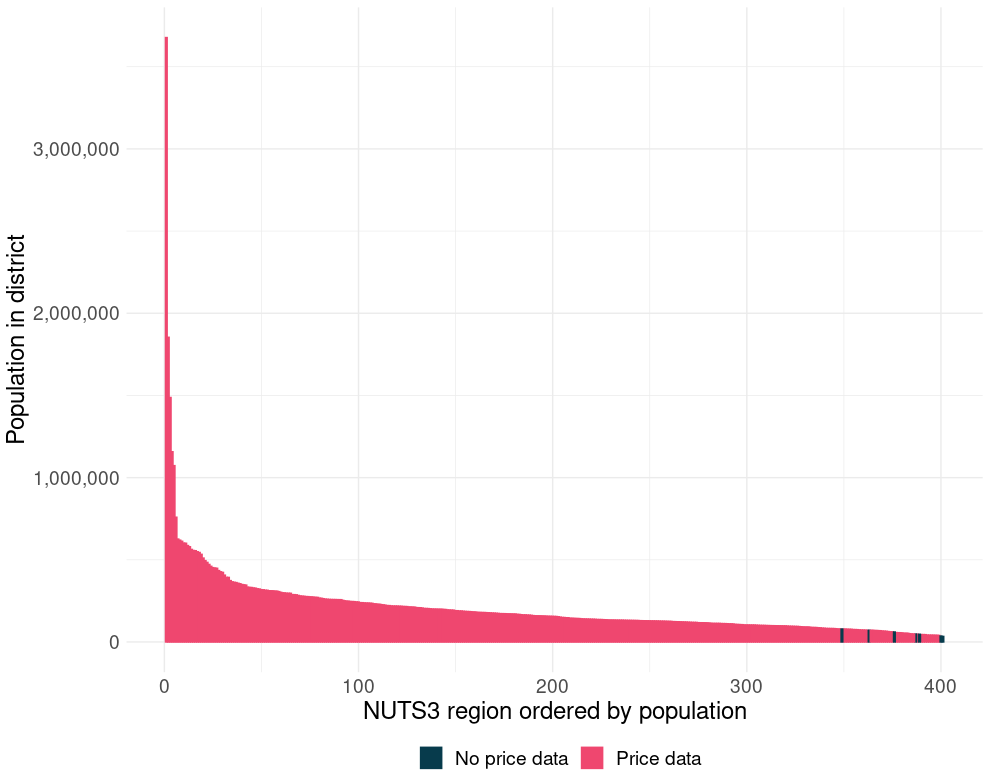
Second of all, not all postcodes have a Kebab place in the survey data. Annoying. The postcodes and kebab places that have been entered into the survey cover around 60% of the German population. Which is. Not too bad since not nearly all postcodes contain a kebab place.
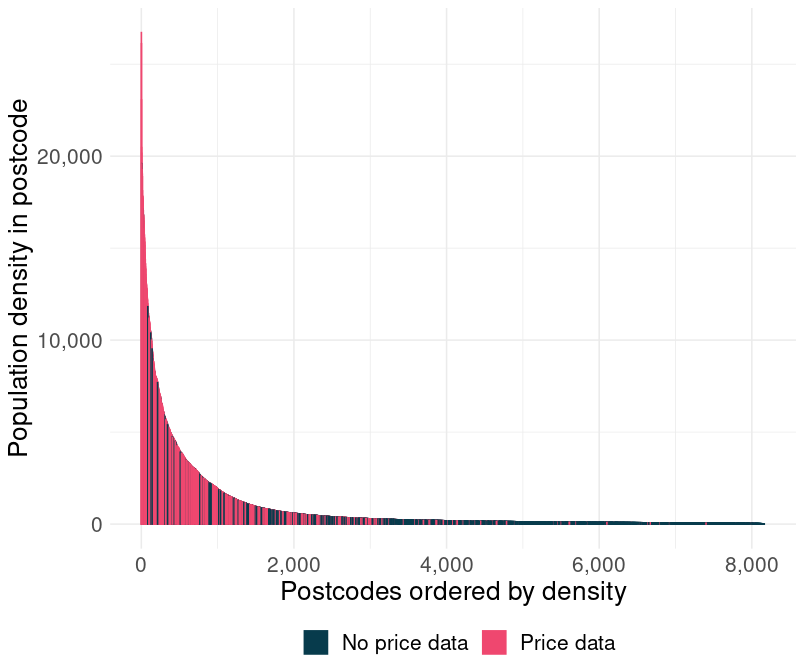
The chart below helps a bit. It is a bar chart. Or density chart. Whatever you want to call it, I don’t really care. But, it displays 8,170 bars. Each represents a postcode. On the y-axis is the number of people living in that postcode and on the x-axis is jut the population rank.
What it shows is that I am missing mostly data from postcodes in which I would expect it to be missing, postcode area that are too small to sustain a profitable kebab place.
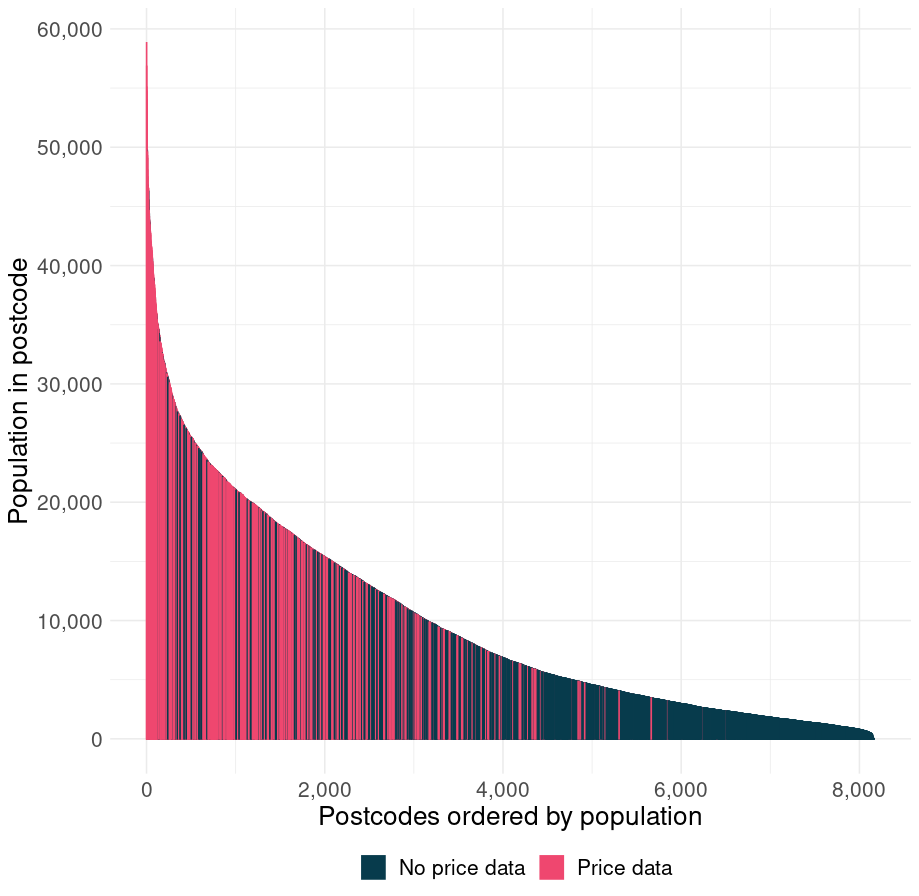
Another, probably better way, of looking at it is by population density. And look at that! I have more or less all the dense döner-friendly postcodes and I am missing loads of small rural postcodes. Many of whom probably don’t have such a shop.
I guess you can now see this black-rabbit-hole and why my willingness to live was quickly fading.
But, I got out of it.
I decided I’d take off my metaphorical micro-economist hat (like a really cool baseball cap or one of those Carhart beanies) and put up my metaphorical macro-economist (one of those nerdy colorful hats with a propeller on top).

With that that hat I figured I could just assume that the error is randomly distributed across postcodes with a mean of zero and on an aggregated level (NUTS3 or NUTS2) I would still have data on a granular enough level for it to be interesting, but not so granular that I can not really rely on results on the level in which I am analyzing the data.
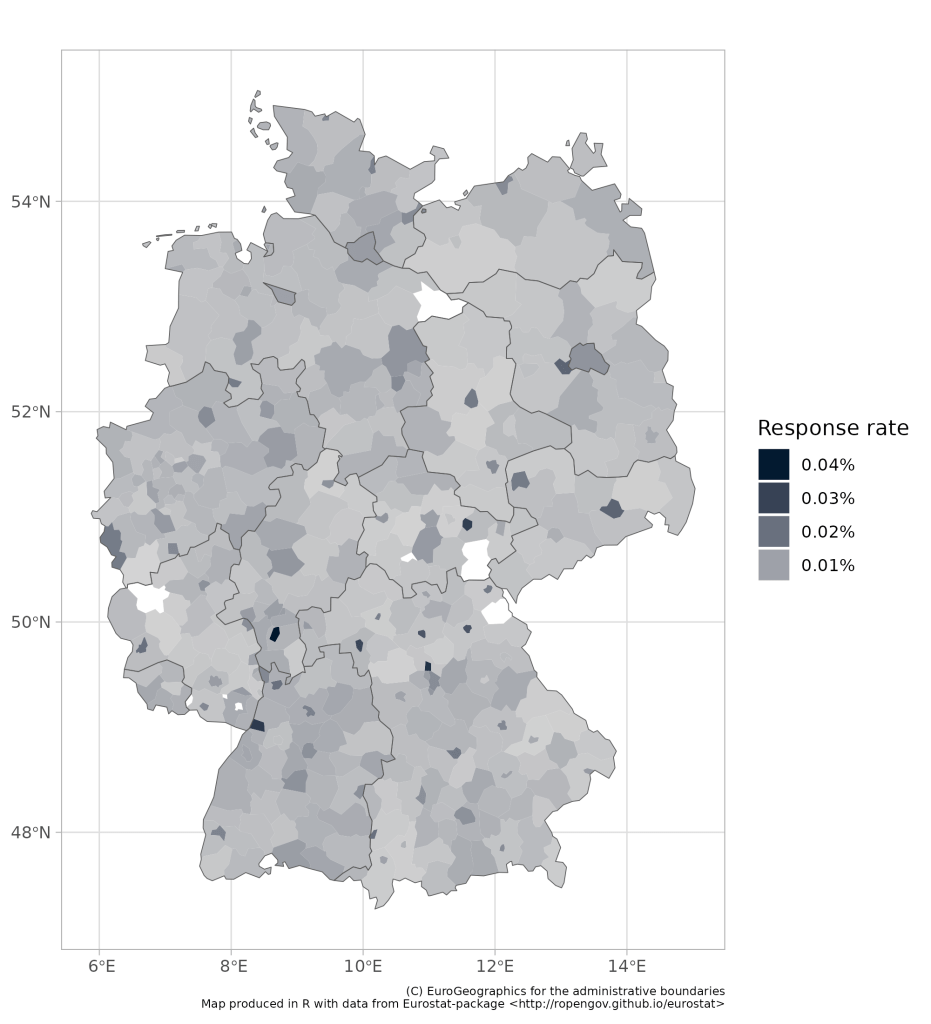
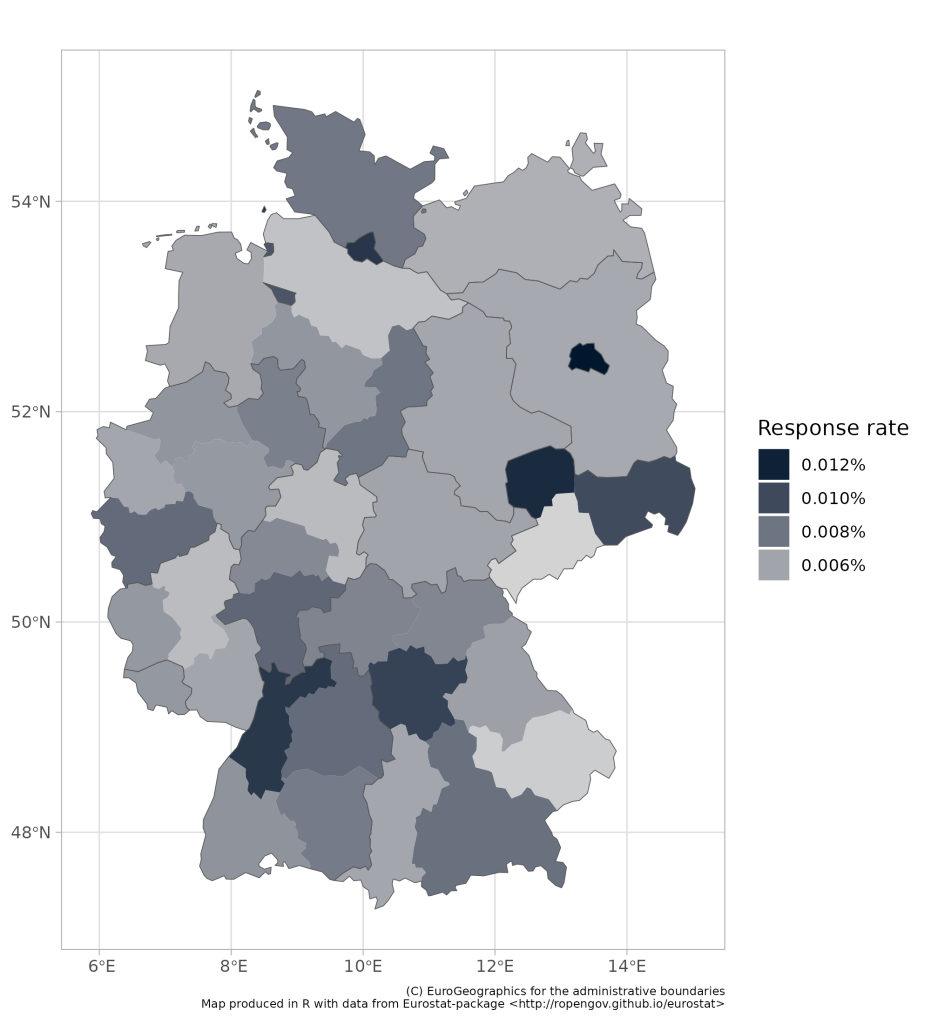
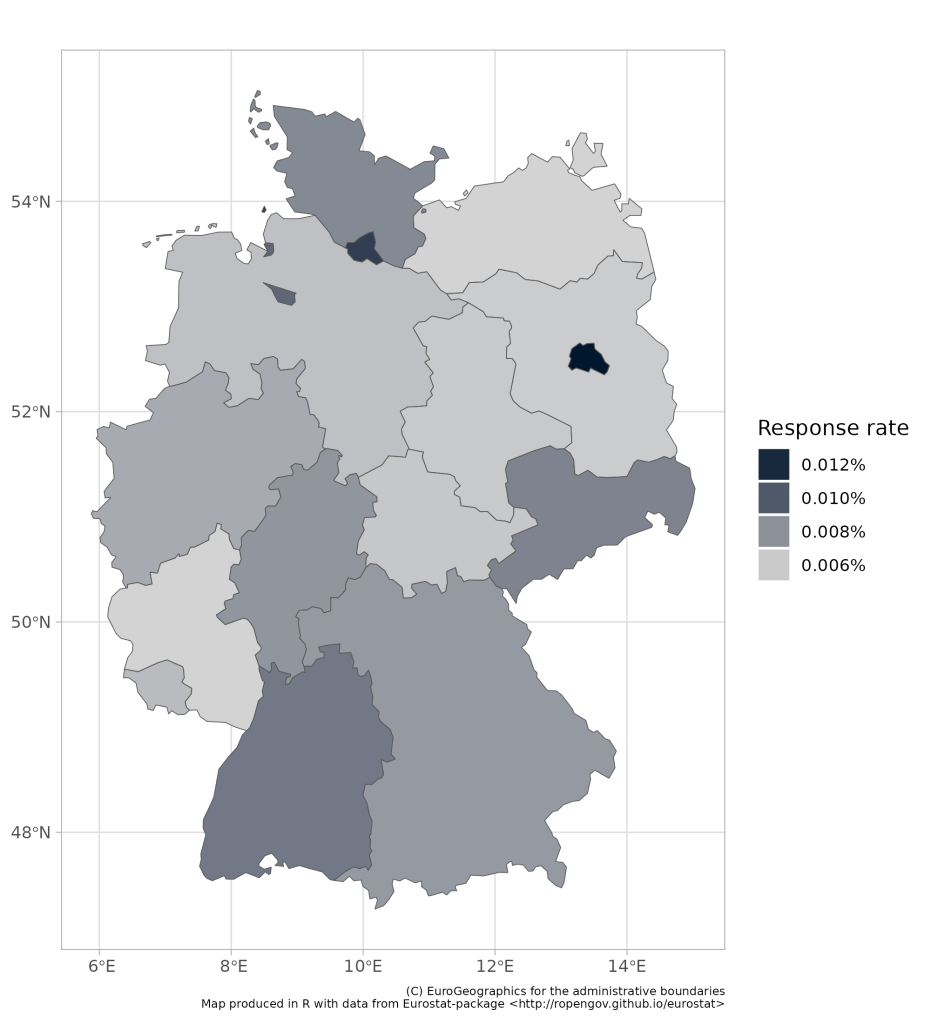
Let’s look at some maps with data—for fun. I have produced 4 different maps. All maps show the number of responses on the Reddit survey, as a share of the population living in the postcode of the kebab shop that the user filled in. Please note, it is a slide show (use the arrows to flip between slides of maps).
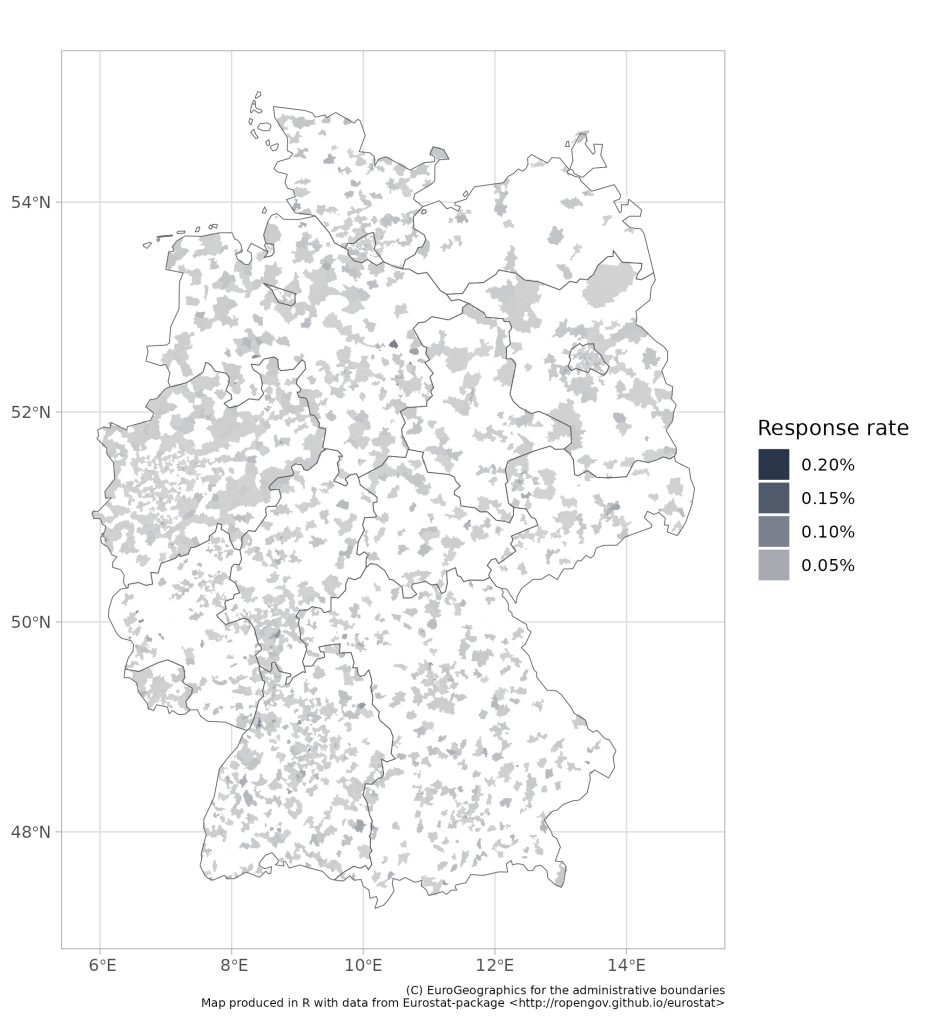
- The first map breaks Germany down into 8,170 postcodes. The Reddit questioner only has responses for 2,538 unique postcodes (but multiple for most postcodes). But since few people and döner places live in many postcodes, I think we are doing pretty well with this data. I mean, we are definitely missing loads of kebab places, but probably not many postcodes with kebab places (although I intend to test this assumption one day).
- The second map breaks Germany down into 401 so called NUTS3 regions. This split is roughly based on the Landkreise (districts), although it is not one-to-one, after all there are only 294 districts in Germany. However, looking at this map, I think I have found a sweet spot right between granularity and usefulness of data. And on this level I am only missing data from the data is from 7 regions with a population of one Iceland–de minimis.
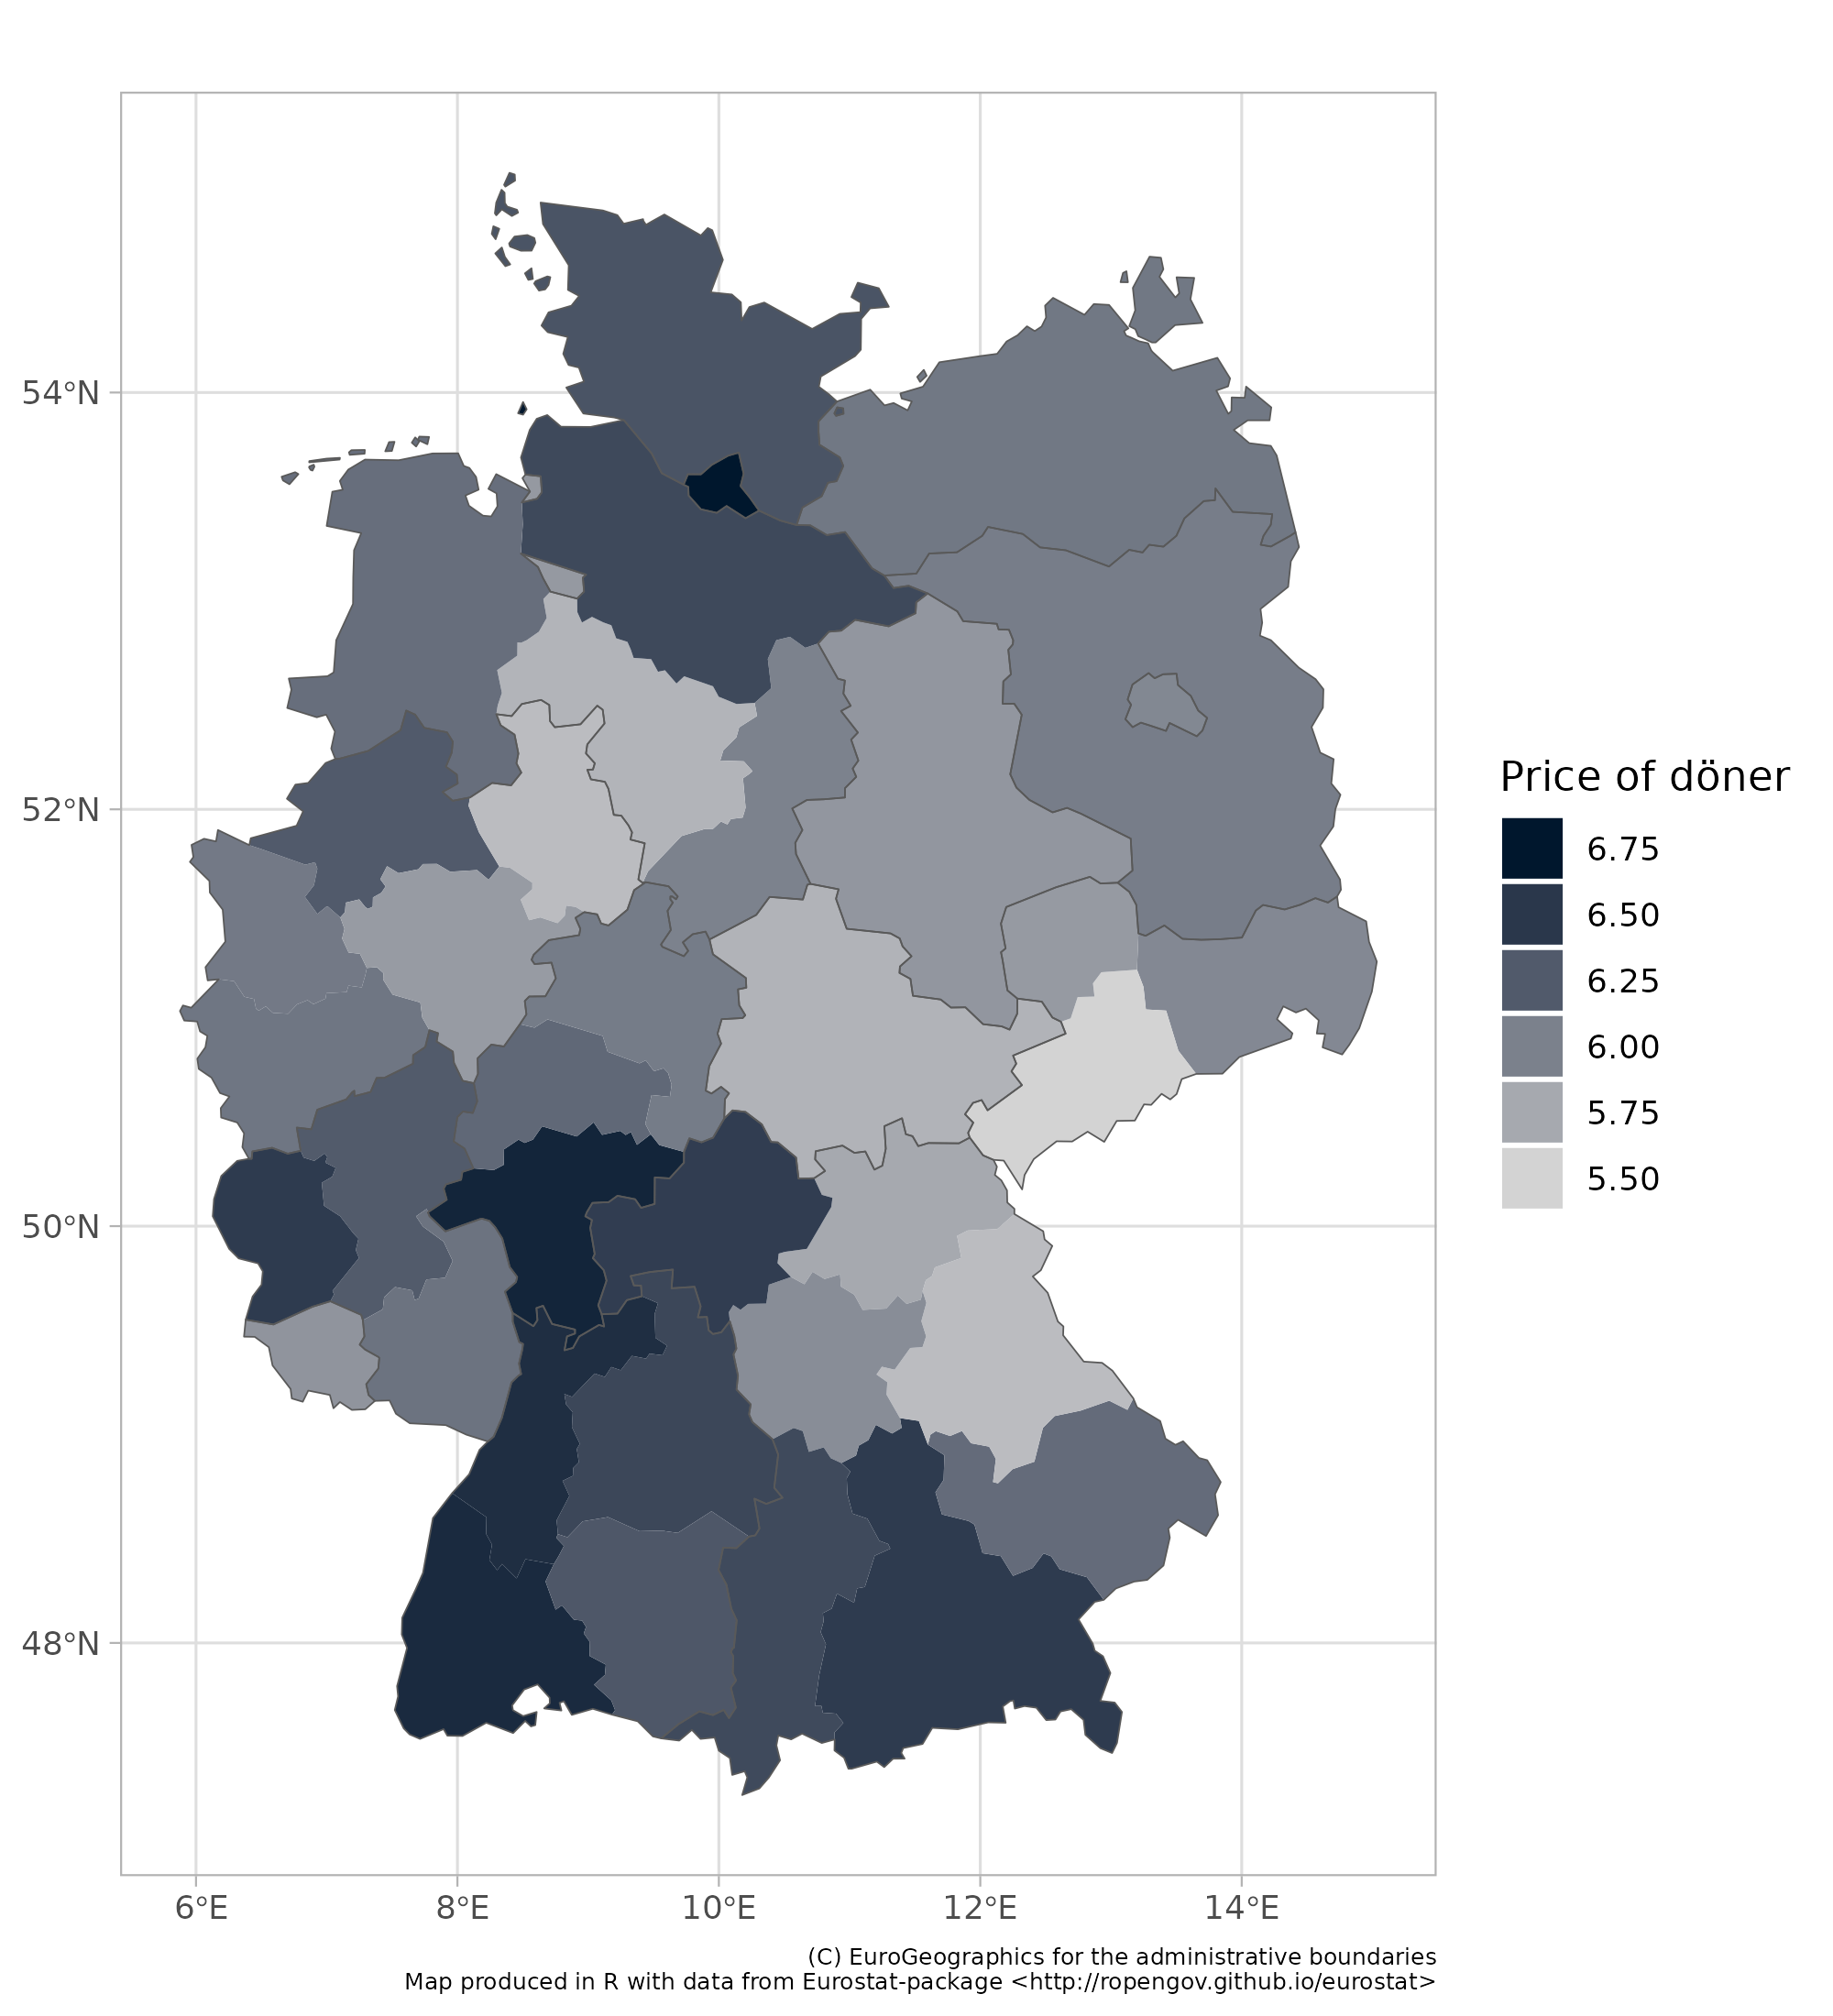
- The third map breaks Germany down into 38 so called NUTS2 regions. This is kinda corresponds with the Regionalverbände (association of regions, I guess). And this is, along with the NUTS3 data, you are going to see here again and again and again. This one is actually fab for two reasons. First, there is tons and tons of data available at this level on other variables that could be influential when it comes to döner prices. Second, it is million times better than the state level map, which is terrible at capturing the within-state differences, which can be massive. (I mean, Köln and Bielefeld are in the same state and these are two very different cities. For example I (and everyone else) actually know that Köln exists, whereas I have no prove, and no consensus exists in Germany on the question of the existence of Bielefeld, allegedly home of over 300k Germans).
- The fourth map is on the state level (16 states), and I am not going to talk much about that, as it is too high level and therefore fairly boring.
Before I exit, I am going to share one more map, just to illustrate the point I made about the niceness of a bit more granular data.
This map shows the average price of a döner, in 38 different German regions. And when you look at this map, focus on Bavaria (south-east). As you move from southern Bavaria to the north, prices fall. And they fall way before Bavaria reaches Thüringen and Saxony (formerly part of east germany). In fact there is hardly a 10 cent difference between the price of döner in northern Bavaria and in Thüringen.
Thanks for reading, this was way to long.
FOOTNOTES
*If a postcode appeared at least once in two different states I assumed that the postcode belonged to the state where the postcode had received higher number of responses. I mean not science, and i think some post codes actually cross boarders, but it is kinda like saying: “if 10 people put postcode 12345 in Hessen and 1 put it in Bavaria I assume it is in Hessen”.

Leave a comment